Capital Policy
Overview
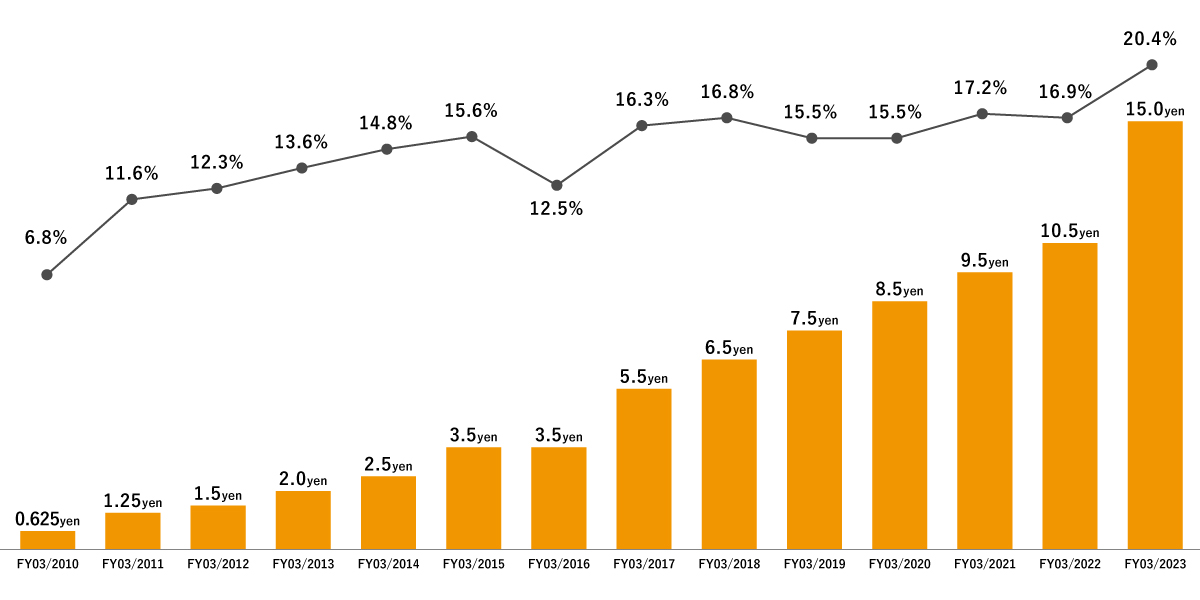
We believe it is essential to contribute to shareholder value by achieving sustainable growth and increasing our corporate value over the long term. We aim to achieve continuous growth in net income, maintaining higher ROE than our cost of equity by efficiently using our limited management resources. As huge business opportunities emerge in the market related to an aging society where we operate, we will use the profits earned to make the necessary investments for sustainable growth and long-term enhancement of corporate value. Therefore, our basic policy for profit distribution is to pay dividends in line with business results for each fiscal year, with a target consolidated dividend payout ratio of 30%, while prioritizing growth investment and considering the financial conditions. However, this does not apply in the event of major investment opportunities such as M&A.
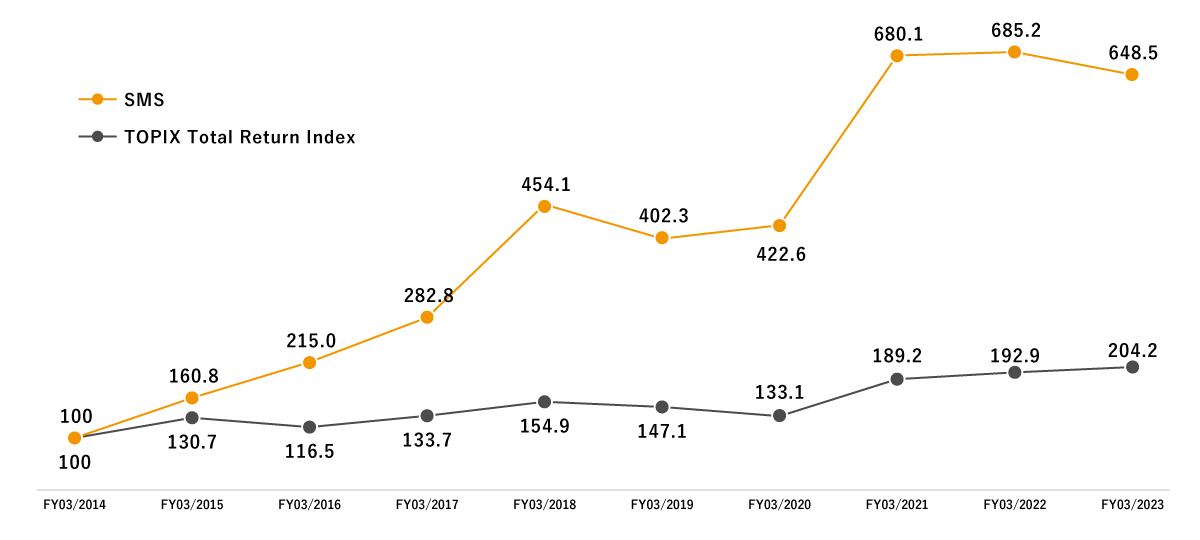
■Total Shareholder Return

- *This total Shareholder Return means the profit generated from all capital gains and dividends from the SMS’s shares during a holding period.
- *The closing price as of March 31, 2014, is set at 100, and the value at the end of each fiscal year is shown if you continue to hold the stock.
■Dividends
Historical Dividend per Share and Payout Ratio

- *Past stock splits are taken into account for the DPS calculation.
■Share Repurchase
Acquisition period
Acquisition method
Number of shares acquired
Total amount
April 30 – May 7, 2024
Market purchase
876,400
1,915,074,100
November 1 – November 8, 2023
Market purchase
853,600
1,999,798,750
February 5 – March 31, 2015
Market purchase
176,600
116,379,900
November 21 – December 31, 2014
Market purchase
470,800
296,464,400
September 19 – September 22, 2014
Market purchase
172,800
120,714,400
April 30 – June 11, 2013
Market purchase
1,275,600
421,009,300
May 1 – May 31, 2012
Market purchase
564,000
81,446,800
Total
-
4,389,800
4,950,887,650
- *Past stock splits are taken into account for the calculation.
| Acquisition period | Acquisition method | Number of shares acquired | Total amount |
|---|---|---|---|
| April 30 – May 7, 2024 | Market purchase | 876,400 | 1,915,074,100 |
| November 1 – November 8, 2023 | Market purchase | 853,600 | 1,999,798,750 |
| February 5 – March 31, 2015 | Market purchase | 176,600 | 116,379,900 |
| November 21 – December 31, 2014 | Market purchase | 470,800 | 296,464,400 |
| September 19 – September 22, 2014 | Market purchase | 172,800 | 120,714,400 |
| April 30 – June 11, 2013 | Market purchase | 1,275,600 | 421,009,300 |
| May 1 – May 31, 2012 | Market purchase | 564,000 | 81,446,800 |
| Total | - | 4,389,800 | 4,950,887,650 |
- *Past stock splits are taken into account for the calculation.